Human Chart Infographics: Modern Data Visualization in After Effects
In today’s information-driven world, presenting data isn't just about numbers; it's about storytelling. Static charts and graphs often fail to capture attention or convey nuance. For professionals, educators, and creators looking to elevate their presentations, Human Chart Infographics for After Effects offers a powerful solution. This specialized template pack transforms demographic data, survey results, and comparative statistics into engaging, animated visuals that resonate with audiences.
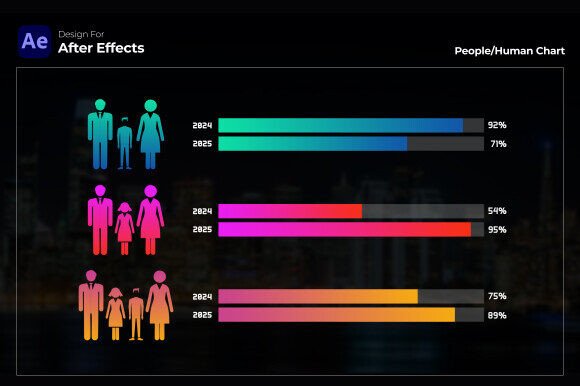
The core idea is elegantly simple: using stylized human icons to represent groups, percentages, and categories. Instead of impersonal bars or pie slices, your data is visualized as collections of people, making the information inherently more relatable. Whether you're showing market segmentation, team composition, or population trends, this approach adds a layer of humanity and clarity that purely numerical charts lack.
Beyond Static Graphics: The Power of Animation
What sets this tool apart is its integration within Adobe After Effects. Animation brings data to life. A static infographic can show a 60% majority, but an animated sequence can build that majority group one icon at a time, emphasizing growth or scale. Transitions between charts become smooth narrative flows, guiding the viewer through complex comparisons without confusion. This dynamic presentation is particularly crucial for video content, web presentations, and live seminars where engagement is paramount.
The pack includes nine distinct, customizable designs. This variety is a key strength. You might choose a stacked layout to show hierarchical layers within an organization, or a grouped design to compare side-by-side categories like regional sales teams. The flexibility ensures you’re not forcing your data into a single, rigid format; you can select the visualization that best serves your specific story.
Key Features for Practical Customization
True utility in a template comes from ease of adaptation. This people chart infographic pack is built with practical customization at its core.
- Diverse & Customizable People Icons: The human figures are modern and diverse, avoiding generic silhouettes. Their colors are easily changed to match your brand palette, ensuring every visual aligns with your company’s identity or presentation theme.
- Flexible Value Display: You control how numbers appear. Beyond just percentages, you can prepend or append currency symbols, text labels (like “users” or “clients”), or any other indicator. This makes the templates suitable for financial reports, user analytics, or any quantified data.
- User-Friendly Design for All Skill Levels: Built for After Effects CC 2023 and above with no plugins required, the project files are logically organized. Even if you’re a beginner to motion graphics, the straightforward layers and controls allow you to modify values, colors, and timing without deep technical expertise. Professionals, meanwhile, can dive deeper to integrate these charts seamlessly into larger compositions.
- Complete Resource Support: A free font link is provided, maintaining the intended aesthetic cohesion. The full resolution output ensures your visuals remain sharp on any screen, from boardroom monitors to online video streams.
Real-World Applications Across Industries
The utility of these Human Chart Infographics spans numerous fields. In a business report, animating customer demographic shifts during a quarterly review can make trends immediately apparent to stakeholders. For marketing presentations, showcasing target audience segments with relatable human icons helps creative teams visualize the “people” behind the data points.
Educators and trainers can use these animations to explain sociological statistics, historical population movements, or class composition in a way that students more readily absorb. Freelancers and consultants can elevate their client deliverables, turning dry data sheets into compelling narrative videos that support their analysis. Even bloggers and content publishers can embed these animated charts in videos to explain complex topics, increasing viewer retention and shareability.
Consider an annual report. A static PDF might list employee diversity statistics. An animated video report using this pack can visualize those statistics growing year-over-year, celebrating progress in a more impactful, human-centered way. The application moves beyond mere display into demonstration.
Evaluating and Implementing the Templates
When deciding to use a resource like this, practical considerations matter. First, assess your primary output medium. These templates are ideal for video, animated web content, and projected presentations. For purely print documents, the static frames can be exported, but the animation value is lost.
Second, consider your data’s nature. The people chart approach excels for data related to groups of individuals—customer bases, survey respondents, population samples, team sizes. For purely quantitative data like temperature fluctuations or stock prices, traditional charts may be more appropriate. This pack is a specialist tool for human-centric data.
Implementation is straightforward. After opening the template in After Effects, you’ll typically find control panels or easy-to-identify text layers where you input your values. Changing colors involves modifying solid color layers or effects controls. The time-saving aspect is significant; building a polished, animated infographic from scratch requires considerable skill and hours. With this pack, you can achieve a professional result in a fraction of the time, streamlining your workflow and allowing you to focus on the data’s message rather than the graphic’s construction.
The Ultimate Benefit: Enhanced Communication
The overarching benefit of using Human Chart Infographics in After Effects is enhanced communication. Data visualization aims to make complex information understandable. By combining the intuitive representation of people icons with the engaging power of subtle animation, you reduce cognitive load for your audience. They don’t just see a number; they see a proportion of a community, a shift in a group’s size, a comparison between teams.
This leads to stronger retention, more effective decision-making based on the presented data, and a more professional perception of your work. In a landscape saturated with bland slides and reports, a well-executed animated human chart becomes a memorable standout. It shows an investment in clarity and audience engagement, qualities that mark any professional, educator, or creator as thoughtful and skilled in their craft.
Ultimately, this template pack is more than just a set of After Effects files. It’s a bridge between raw data and human understanding, providing a unique and modern touch to the essential task of showcasing what our numbers truly represent: people.