Creating Dynamic Line Chart Infographics in Premiere Pro
In the world of presentations and reports, data often gets lost in spreadsheets and dry tables. Your audience craves clarity, insight, and a visual story. That’s where professional data visualizations come in, transforming numbers into narratives. For video editors and content creators working in Adobe Premiere Pro, a powerful solution exists: the Dynamic Line Chart Infographics Premise Pro template pack. This isn’t just a set of static graphics; it’s a system designed to bring your data to life on screen with efficiency and style.
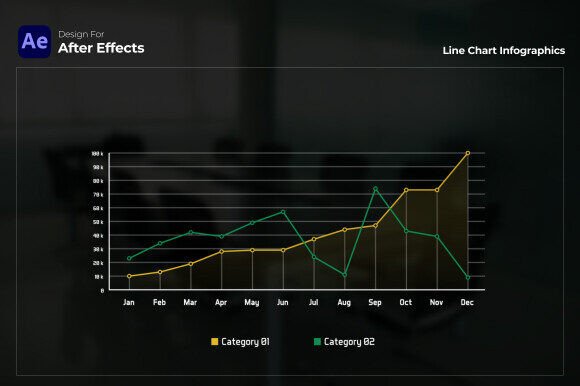
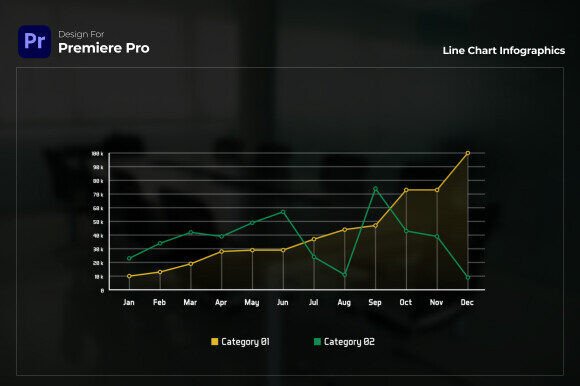
The pack offers nine distinct, fully customizable line chart designs. Visually, they lean into a clean and modern aesthetic, characterized by refined gradient styles applied to each chart. These gradients aren’t mere decoration; they add depth and a contemporary polish, helping different data trends stand out with subtle color transitions. The overall personality of these templates is professional yet approachable. They communicate authority and accuracy without feeling cold or technical, making them perfect for engaging viewers who might otherwise glaze over at raw statistics.
The Practical Power of Automated, Customizable Charts
What sets this template apart is its blend of smart automation and creative flexibility. The core feature of automatic value calculation is a significant time-saver. You simply input your data points—whether it’s quarterly sales figures, website traffic over time, or project milestone progress—and the template handles the scaling and plotting. This removes a tedious, error-prone step and lets you focus on the message rather than the math.
Equally important is the ability to adjust the chart quantity effortlessly via an intuitive dropdown menu. Perhaps your initial dataset had five key metrics, but your final report only needs to highlight three. Or maybe a follow-up presentation requires adding two more trends. This adaptability means one template can serve multiple projects and stages, providing true versatility. The user-friendly design ensures this power is accessible whether you’re a seasoned video professional or a marketer just starting to incorporate motion graphics into your presentations.
Ideal Applications: From Boardrooms to Classrooms
The applications for these Dynamic Line Chart Infographics Premiere Pro templates are vast. In business reports and annual reports, they convey growth, performance, and forecasts with a credibility that enhances stakeholder confidence. For marketing presentations, they can visualize campaign engagement, ROI trends, or market research data, making your results compelling and easy to grasp.
Beyond the corporate world, they shine in educational videos, where clear visualizations aid learning and retention. Bloggers and publishers can use them to elevate explainer content or data-driven stories. Even entrepreneurs and small business owners creating pitch decks or internal updates will find these templates elevate their communication. The Full HD 1920×1080 resolution ensures quality across screens, and the inclusion of free font links maintains visual consistency without extra cost.
Streamlining Your Creative Workflow
Technical details matter, and this pack is built for a smooth integration. Compatible with Premiere Pro CC 2023 and above, it requires no third-party plugins, reducing friction and potential instability. The "fully customizable" promise extends to colors, gradients, and labels, allowing you to align the charts perfectly with your existing brand identity. This is crucial for maintaining visual hierarchy and brand consistency across all your materials. When your data visualizations share the same color palette and stylistic tone as your logo and other design assets, you reinforce professionalism and brand recognition.
Consider a practical scenario: You’re preparing a quarterly review video. Instead of spending hours manually crafting graphs in another application and importing them, you work directly within Premiere Pro. You input the data, select the gradient style that matches your company’s accent colors, adjust the number of lines to feature your three main product lines, and within minutes, you have a dynamic, animated chart ready to be sequenced with your narration. This time-saving aspect directly impacts your creative workflow, letting you produce more engaging content faster.
Evaluating the Fit for Your Projects
When considering a tool like this, think about the nature of your projects. If your work regularly involves presenting trends, comparisons, or time-based data in video format, this template pack is a logical investment. It’s particularly suited for projects where modern typography and a clean look are valued. Test its fit by reviewing the types of data you most commonly present. Do they benefit from a line chart format? The ability to show change over time is the hallmark of a line chart.
For font pairing, since the template provides the font links, you can easily ensure text overlays and titles harmonize with the chart design. Readability considerations are handled by the clean lines and ample space in the design, ensuring data points and axes labels remain clear even on smaller screens or in fast-paced video sequences. From a licensing perspective, using these templates within your Premiere Pro projects for commercial work—like client reports, public marketing videos, or educational courses—is straightforward, as they are designed as commercial creative fonts and assets for such use.
Ultimately, the Dynamic Line Chart Infographics Premiere Pro template pack is about empowering you to tell better stories with data. It moves beyond simple data visualization to create engaging, professional, and easily adaptable motion graphics that resonate with your audience. By combining automated calculation with customizable design, it addresses both the practical need for speed and the creative desire for impact, making it a valuable addition to the toolkit of any designer, marketer, or content creator working in video.