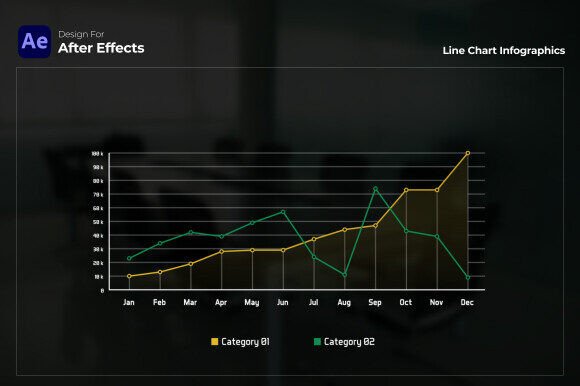
Dynamic Line Chart Infographics for After Effects
In the modern landscape of communication, static numbers on a spreadsheet rarely capture attention or convey meaning effectively. Whether you're presenting quarterly sales figures to your board, explaining a complex trend in an educational video, or showcasing marketing campaign results, the visual representation of data is paramount. For users of Adobe After Effects, creating these visuals from scratch can be a time-intensive process requiring deep technical knowledge. This is where a specialized Line Chart Infographics After Effects template pack becomes a transformative tool, not merely a collection of graphics, but a bridge between raw data and compelling storytelling.
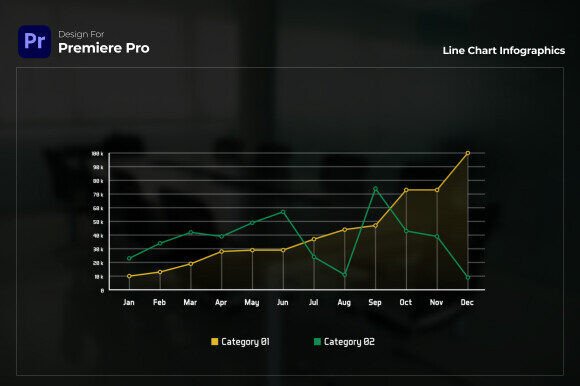
These templates are engineered to convert numerical datasets into animated, professional line charts directly within After Effects. The core value lies in their dynamic nature. Instead of a flat, final image, you can create visuals where lines animate to their peaks, values populate smoothly, and the entire chart builds itself on screen. This animation is not just decorative; it guides the viewer's eye and emphasizes the narrative you're constructing around the data. It turns a report into a presentation and a presentation into an engaging experience.
Turning Data Workflows into Creative Processes
The practical benefit of using such a template system is a fundamental shift in workflow. Consider the common task of updating a monthly performance report. Traditionally, you might export data to a separate charting tool, create a static graphic, import it into your video project, and then perhaps add basic animation. This multi-step process fractures your focus between data accuracy and visual design.
A fully customizable Dynamic Line Chart template embedded in After Effects collapses these steps into one cohesive environment. You input your values directly into the template's controls. The automatic value calculation feature handles the scaling and positioning of data points on the chart, eliminating manual plotting errors and saving considerable effort. This means you spend your cognitive energy on interpreting the data and crafting the message, not on the mechanics of graph creation.
Furthermore, the customizable chart quantity via an intuitive dropdown menu offers remarkable flexibility. Perhaps your initial dataset has five key metrics, but for a specific stakeholder presentation, you need to focus on just three. With a few clicks, you can adjust the template to display exactly the number of lines required, ensuring each visualization is tailored to its specific audience and context. This level of adaptability supports both efficiency and precision in communication.
Elevating Professionalism Through Design and Accessibility
Beyond functionality, the aesthetic impact is significant. The inclusion of a refined gradient style for each line chart provides a modern, polished look that elevates the perceived quality of your entire project. In professional settings, the clarity and style of your visuals directly influence credibility. A clean, contemporary chart design helps data feel authoritative and trustworthy.
Accessibility is another cornerstone. The template is designed to be user-friendly for both beginners and seasoned professionals. For someone new to After Effects, it offers a manageable entry point into data visualization without needing to learn complex expressions or scripting. For experts, it provides a robust starting framework that can be deeply customized, saving time on repetitive foundational work. The provision of a free font link ensures typographic consistency, allowing you to maintain a cohesive visual identity without hunting for matching fonts or dealing with licensing issues.
This combination of professional design and ease of use makes it ideal for a wide range of applications. Entrepreneurs can create persuasive investor pitch decks. Marketers can animate campaign ROI trends for client reviews. Educators can build videos that clearly illustrate historical or scientific trends. Freelancers and small business owners can produce high-quality content for reports or social media without a dedicated design team.
Real-World Applications and Considerations
Imagine a marketing manager preparing a year-end review. Using a Line Chart Infographics After Effects template, they can animate monthly website traffic, conversion rates, and ad spend. The animated lines not only show the trend but can sequentially reveal each metric, walking the audience through the story of the year's successes and challenges. The time saved by automatic calculation allows for last-minute data updates, ensuring the presentation is always current.
For an academic creating an online course module on economic growth, dynamic line charts can vividly illustrate GDP changes over decades. The smooth animation helps students follow the progression visually, aiding comprehension and retention far more than a textbook graph.
It is important, however, to consider the fit for your specific needs. These templates are compatible with After Effects CC 2023 and above and require no plugins, which is excellent for stability and ease. They output at Full HD 1920×1080 resolution, suitable for most digital presentations and videos. If your work regularly demands ultra-high-resolution outputs like 4K or specialized formats, you would need to verify scalability or explore other options. Likewise, while the pack offers nine distinct designs, if your project requires highly non-standard chart types (like logarithmic scales or unique hybrid charts), some manual After Effects work would still be necessary. The template is a powerful accelerator, not a universal substitute for all custom design.
The Strategic Advantage of Integrated Visualization
Ultimately, the strategic advantage of using a dedicated Line Chart Infographics pack in After Effects is the unification of your data narrative and your visual production. By bringing the chart creation directly into your primary motion graphics software, you maintain creative control throughout the process. You can match the animation style of the charts to other elements in your video, synchronize reveals with voiceover or music, and ensure a perfectly cohesive final product.
This integration supports stronger communication by allowing you to design the data presentation around the pacing and emphasis of your story. It simplifies decision-making because you can experiment with different data highlights or chart quantities quickly, seeing the results in real-time within your composition. It solves the common problem of disjointed, low-impact data slides.
In a world where audiences are inundated with information, the ability to present data clearly, attractively, and dynamically is a significant competitive edge. For professionals, creators, educators, and business owners who regularly use After Effects, leveraging a well-designed template for line chart infographics is a practical step toward achieving that edge. It transforms data from mere numbers into a visual, persuasive, and engaging component of your message.